ROLES OF STATISTICAL ANALYSIS CONSULTING FIRMS / COMPANY

ROLES OF STATISTICAL ANALYSIS CONSULTING FIRMS / COMPANY

Statistical analysis consulting firms / company, as a third party to help researchers or students gaining a master’s degree or doctoral degree. It has multiple roles and tasks as well as restrictions of providing services. Why should be some restrictions? Obviously, there is task of consultant and task of student. main idea of the research is student task. The consultant can not replace its task. Otherwise,the main task of consultant is to assist technical tasks. The task as follows:

Data Analytics Consultant Give Consider Methods

Due to lake of statistical analysis knowledge, student need help of data analytics consulting. They can assist a researcher to provide appropriate methodology and research design, rightly. Whether quantitative or qualitative research methods are suitable the research. Prospective research design or retrospective. Is it necessary observational studies, surveys, or even experimental design? Furthermore, they can assist technical task to input the data into computer. In term of  research methodology, the consultant has comprehensive overview. He can give alternative view of some research methods and its advantages. Indeed, the researcher has to choose appropriate one.

Statistical Data Analysis Services

Researchs use consultant when they have to time to running the data. Commonly, they use statistical software such as: SPSS, EVIEW, Amos, PLS, Lisrel. Hence, they would need to technically assist in the work of running data. It should not be lost is that researchers stay understand the processes and procedures of data processing. The reason to choose a particular software and reason to use certain analytical methods. Technical matters related to the running of data can be done by the consultant.

Provide Consultation of Data Analysis

One of the most important in research is to interpret the data. Without interpretation, statistical results only numbers without meaning. Researchers will discuss with data analytics consulting to find any figures. They may explain the data meaning on the software output.

Actually, consultant expected able to help researchers writing better research. Better use appropriate research methodology. Researchers, actually can just use a random method of statistical analysis and statistical software like SPSS and the output would be come.

Secondly, statistical consulting firms / company can give time efficiency to the researchers. Researcher could save time one or two weeks or even months. To learn various methods of research is not an easy thing. Moreover, statistical analysis methods are many kinds. Researchers who do not have background in mathematics or statistics may be difficult to learn strange terminology.

Restrictions of Data Analytics Consulting Task

Eventually, there are some limitations in using the services of consultants.

  • Researchers should not use the services of consultants to find main ideas of the research.
  • Researchers should not ask for the help of consultants to do plagiarism.
  • Researchers should not use consultants to replace the role of researchers.
  • Finally, Researchers should not assume that the consultants’ work is theirs
Descriptive Statistics Definition and Examples

Descriptive Statistics Definition and Examples

Descriptive statistics definition and examples will be discussed in this article. The definition is a method of statistical analysis that only describe the condition of the data examples. Descriptive statistics do not draw conclusions larger than the sample. For example: Researcher conducts a research with 100 students as sample size. The conclusions drawn only for 100 students, no more. An example of a descriptive statistics in the health subject: A study measures the prevalence of TB in certain areas. It measures the effectiveness of a drugs in healing a disease. Necessarily, its conclusion only cover for that area. Other example of descriptive statistics in economic research: Average movement of stock prices on the stock exchange. The volatility of commodity price indexes on the futures exchange.

Commonly, Descriptive statistics describes a variable. Possibly, it also illustrate between two or more variables. For example, study on gender towards blood pressure in a hospital. The variable only blood pressure and gender as control variable. We may increase the number of variable such as age or life style. In political study, gender, age range, educational level to be important variable in choosing a candidate for leader in the election. Descriptive statistics does not merely involve only one variable. Two or more variables are possible. Essentially, the conclusions only cover the sample size.

Descriptive statistics is different with inferential statistics. In inferential statistics, the conclusion can be drawn beyond the sample size. For example, a research using 100 students as sample size, but the conclusion draws for whole college. Researcher want to examine the study habits of students in a college that has a total of 20 thousand students. Researchers certainly don’t need to interview 20 thousand students. It is enough to interview 100 to 300 students  to get the conclusion of all college. 

Descriptive VS Inferential Statistics

Inferential statistical examples in health and medicine subject:  we want to examine effectiveness of anti-hypertensive drugs A compared to drugs B. It takes 50 sample size for control and 50 sample for treatment. In inferential statistics, the conclusion was not only for 100 samples but can be greater. Another example in economics: the effect of fiscal policy toward economic growth in a country. The study uses time series data samples for 5 years. In inferential statistics, conclusions can be more than 5 years or more.

Key word of inferential research is testing the hypothesis. we temporarily test the allegations of researchers by using little data or samples of the real situation. hypothesis testing is what distinguishes descriptive statistics and inferential statistics. In descriptive statistics, there is no hypothesis testing.

The similarity of descriptive and inferential statistics is both methods are quantitative method. They use statistical measurements as conclusions. Mean, median, mode and standard deviation are the statistical measurements. Merely, In a descriptive statistics,  mean, median and mode and standard deviation only describes the sample size. whereas, in inferential statistics, there is a standard error which is the gap of mean median and mode in between sample and the population.

Furthermore, we discuss descriptive a statistics definition and me examples, we need to analysis the software. SPSS is a familiar tools widely used in various field of science. In the next article, it will be peeled out.

Linear Regression Analysis Definition

Linear Regression analysis is a statistical analysis method predicting the relationship between the independent and dependent variables. Actually many other analytical methods that can to measure the relationship between variables, but the regression analysis focuses on the relationship between the dependent variable (dependent variable) with independent variable (independent variable). In particular, regression analysis helps researchers to determine changes in the dependent variable caused by the independent variable, where other variables is constant.

Linear Regression analysis includes in group of causality analysis. In causality relationship, one variable affects other variables. independent variable is random, while dependent variable is fix. Regression analysis is different with the correlation analysis where no variable that becomes the cause variable to another variable. Therefore, in statistics, the correlation between the two variables in the analysis are constant.

Theoretically, correlation analysis figures the relationship between variables that does not have a causal relationship. Both of these variables are related only by chance. For example, the relationship between weight and height’s student. The body weight and height is probably related but the weight, certainly not cause the height or vice verca. The relationship pattern is not the same as pattern on causal relationship. The effect of certain drugs against diseases is a good sample for causality relationship.

In Linear Regression analysis, we can involve one independent variable and one dependent variable, which is commonly called a simple regression analysis. We can also involve more than one independent variables with the dependent variable which is commonly called multiple regression analysis.

Linear Regression Analysis Formula

Simply, Regression has formula as follows:

Y = a+bx+e

Y represents the independent variable. it is the response variable that will change when the x variable changes. a represents a constant/ intercept. It is a basic value that is not influenced by X variabel. Meanwhile, b represents the regression coefficient. It shows the influence value of x variabel to y. e for error is the gap between population model and sample model.

Data Analysis in Quantitative Research Proposal

Data Analysis in Quantitative Research Proposal

Definition of Data Analysis

Data analysis in quantitative research proposal is one part of the chapter that researchers need in the beginning of writing a research proposal. Whereas in the research, it is an activity after the data from all collected. Activities in data analysis are: grouping data based on variables and types of respondents, tabulating data based on variables from all respondents, presenting data for each variable studied, doing calculations to answer the problem formulation, and doing calculations to test the proposed hypothesis.

Quantitative Data Analysis Techniques

In a research proposal, it must be clear what method of analysis is capable of answering the research hypothesis. Hypothesis is a temporary answer to the research problem. Data analysis techniques in quantitative research commonly use statistics. There are two kinds of statistical data analysis in research. These are descriptive statistics and inferential statistics. Inferential statistics include parametric and non-parametric statistics.

Descriptive statistics

In preparing research proposals, researchers need to explain what is descriptive research. Descriptive statistic is a method to analyze data by describing data without intending to make generalizations. Descriptive statistics only describes the sample data and does not make conclusions that apply to the population. While, conclusion that applies to the population, then the data analysis technique is inferential statistics.
In addition descriptive statistics also function to present information in such a way that data generated from research can be utilized by others in need.

Inferential Statistics

When researchers want to generalize broader conclusions in the research proposal, it is necessary to write inferential statistics. Inferential statistics (often also commonly inductive statistics or probability statistics) are statistical techniques used to analyze sample data and the results are applied to populations. It requires a random sampling process.


Inferential research involves statistical probability. Using of probability theory is to approach sample to the population. A conclusion applying to the population has a chance of error and truth level. If the chance of error is 5%, then the truth level is 95%. While the chance of error is 1%, then the truth level is 99%. This opportunity for error and truth is the level of significance. Statistical tables are useful for carrying out tests of the significance of this error. For example, t-test will use table-t. in each table provides significance level of what percentage of the results. For example the correlation analysis found a correlation coefficient of 0.54 and for a significance of 5% it means that a variable relationship of 0.54 can apply to 95 out of 100 samples taken from a population.

Inferential statistics is a higher level then descriptive statistics. To that in the research proposal, the flow of conclusions becomes clear. Data Analysis is to make general conclusions (conclusions), make a prediction (prediction), or make an estimate (estimation).

Quantitative Research Method Definition

Quantitative Research Method Definition

Quantitative research method defines as a scientific approach that views a reality. It should be classified, concrete, observable and measurable the relationship of variables. Commonly, the data presents in the form of numbers and uses statistics method as a tool of analysis.

Quantitative research process begins with an activity of exploring the problems. Therefore, formulating research problems must be clearly. Even though, research problem in quantitative research is still temporary but it will develop after along the process. Relevant theories are to design research models and research parameters as well as the basis for making hypotheses. Theory will be the basis in the preparation of variables. In survey research, questionnaires/instruments are arranged based on research variables. The instrument need to test whether is valid and reliable. Data analysis which leads to examine the hypothesis.

Basically, quantitative analysis consists of several stages. Approximately, formulating the problem, constructing a model, obtaining data, finding solutions, testing the hypothesis, analyzing the data, and interpreting the results.

Method of analysis should refer to the purpose of study. Previously, researcher needs to identify whether the data meets the basic assumptions. While using questionnaire, data checking needs to support analysis. It need to clean the data, extreme values ​​(outliers), completeness the data.

Selection of Quantitative Methods

Format of quantitative research in social science depends on the problem and purpose of the research. There are two quantitative research formats: descriptive format and explanatory format.

The quantitative approach is deductive (from general to specific). It starts from a theory. This approach aims to test hypotheses and establish the facts or truths of a theory. The theories put forward as a standard to state whether or not a phenomenon occurs. Hypothesis is as a reinforcement of the assumption that quantitative research intends to see the relationship between variables. The final orientation is to make a conclusion that can be generalized more broadly. At the beginning, it has to be clear objections, and clearly design. For example, clarity of design, subject, variables, data, and analysis techniques. Hence, the quantitative approach is more stable. It does not allow re-designing the research procedure.

Quantitative research Characteristics

Certainly, Quantitative research has characteristics as follows:

Using deductive thinking patterns that try to understand a phenomenon by using general concepts to explain specific phenomena .
The logic of thought used is the logic of positivism and avoiding things that are subjective.
The aim of quantitative research is to compile nomothetic science, that is science that seeks to make laws from generalizations.
Data collection measures objective and use standard tools.
Contrarily, researchers position separately from the object of research. so the researcher does not emotionally involve with the research subject. Otherwise, qualitative research depends on the researcher.
In data analysis, researchers require to understand statistical techniques. It is able to analyze data after collected.
The quantitative research process follows a planned procedure involving numbers and data quantification.
The results of the study are generalizations and predictions. It is free of the context of time and situation.

Advantages of Qualitative Research Methods

Advantages of Qualitative Research Methods

A qualitative research methods is a process of research and understanding based on methodologies that investigate social phenomena and human problems. In this approach, the researcher makes a complex picture, examines words, detailed reports from the respondents’ views, and conducts studies in natural situations. Bogdan and Taylor (Moleong, 2007: 3) suggest that qualitative methodology is a research procedure that produces descriptive data in the form of written and oral words from people and observed behavior. Hence, this is the advantages of qualitative research methods. Researchers don’t need to use complicated statistical methods. it just use descriptive analysis.

Moreover, Qualitative research conducts natural conditions and discovery. In qualitative research, researchers are key instruments. Therefore, researchers must have the provision of theory and broad insights. So they can ask questions, analyze, and construct the object under study to be clearer. This research emphasizes the meaning and bound values. Qualitative research is powerful if problems are not yet clear. Even more, It finds out hidden meanings, understand social interactions, develop theories, ascertain data truths, and to examine developmental history.

Characteristics of Qualitative Research

Simply, Qualitative research is different from other studies. To find these differences, there are come characteristics of qualitative research:

  1. In qualitative research, a researcher collects data in original or natural conditions.
  2. Particularly, qualitative research concerns with the process than the results. It means in data collection often pay attention to the results and consequences of various variables influencing each other.
  3. The background of behavior or deeds search for meaning. Thus, what is behind human behavior is central to qualitative research. Prioritizing direct data or “first hand”. Qualitative research demands as much as possible for researchers to conduct their own research activities.
  4. Furthermore, the triangulation method is extensively both triangulation methods and triangulation of data sources.
  5. Concern on contextual details. The researcher collects and records very detailed data about things in the study.
  6. The subject under study is the same position as the researcher, so it is not an object or a lesser position.
  7. Prioritizing the emic perspective, meaning that the respondent’s views are concerned, namely how he views and interprets the world and its standpoint.
  8. Verification. The application of this method is through conflicting or negative cases.
  9. Use the “Audit trail”. The method in question is to include the method of data collection and analysis.
  10. Theory is basic. With data obtained from research in the field, formulate conclusions or theories.

Advantages of Qualitative Research

  1. Purposive sampling. The qualitative method uses a small sample and is chosen according to the purpose of the study. Less data means less cost.
  2. Since the beginning of the study. The data obtained are immediately analyzed until considered adequate results. it does not require a long process of data analysis.
  3. The researcher as a research tool, means that the researcher as the main tool for collecting data is the data collection method based on observations and interviews. It has flexibility in data collection
  4. In qualitative research, descriptive data collection write in the report. Data obtained from this research are in the form of words, images, and not numbers. it does not require complicated statistical methods.

Validity and Reliability of Survey Instruments

In this article, we will discuss theory about the validity and reliability of survey instrument prior to reliability. The validity is a test to measure the questionnaire content. There are three types of validity of which is:

1. The validity of contents

When a test use content validity, the items designed in a survey instrument should represent all possible indicators. The items designed as individually question allows other items broadly. Instantly, where a test tool to measure a person’s aptitude, the test tool will be difficult to define, a judgment of an expert may be able to provide an assessment of the relevance of the question items.

2. The validity related to criterion (criterion-related validity)

A measuring survey instrument is valid when it is able to measure its effectiveness in measuring criteria or indicators. In such validity, measurement or procedure will be measured by the value that has been proven valid or reality on the ground. An example, the test validity of written test for a driver, the test can be valid if the driver able to drive properly in the reality.

Test the validity of the criteria can be divided into two groups.

a. Concurrent validity

Is a validity test for survey instrument in which the criteria is similar with the benchmark. An example examines level of depression: a test has concurrent validity if it is to measure the level of depression that is being experienced by the participant. Simply, it able to measure the object in different time.

b. Predictive validity

While, predictive validity measures after testing. An example is the aptitude test, which helps measure the likelihood that someone is going to be successful on a carrier or a particular job. Researchers will only know after the study subjects underwent their work.

3. Construct Validity

Meanwhile, A validity test of survey instrument has construct validity if it is able to measure the relationship between predictions of the theoretical and empirical value.This construct validity measures the fit between the theoretical concept with more specific measurements items to measure the construct. While, Test intelligence is one example for testing the construct validity test. Finally, Researchers need to define variable then make specific measurements reflecting its latent variable.

Reliability

Reliability is consistency of research instrument when measured in different times or different subjects. Occasionally, two assessors conduct an instrument test and comparing the results. Whether it is similar, reflecting reliability. Likewise, a tools compared in different time. Consistent results mean the reliability of tool.

Difference Between Correlation vs Causation

Difference Between Correlation vs Causation

Correlation vs Causation is a common term in scientific and health research. Among which several differences can occur. Identified Finding the true cause of a phenomenon is difficult to do as scientists tell you. Sometimes, the correlation and causation are closely related, but often they are not. Basically, tend to assume that if two events have correlation, they also have causation. But this does not happen in the majority of cases. This is a problem the difference between cause and correlation. It is a mistake to assume that just because two events have correlation, both tend to cause each other. This error or tendency refer to as causal non-causal pro-causa in Latin, or simply because of the cause.

Correlation

Correlation highlights that there is a relationship between two things; but does not predict causality. Indeed, correlation and causation is similar. One event definitely leads to another thing, it’s easy to build a causal relationship. If two events occur in a phenomenon, but one does not cause the other, they are only correlated and not causal.

It is easy to say that students who watch and play video games that are full of violence, blood and gore become aggressive in nature. But it is not certain because many still remain normal even after playing in many of these games. Here it would be more appropriate to say that violent games and violent behavior has correlation. But do not always have a cause and effect relationship. Hence, there is a causal relationship between watching violent video games and subsequent aggressive behavior, every child who watches and plays this game will become abusive. The parents have to ban this game.

Sometimes researchers do not just want to know a variable correlated with other variables or not. What he wants to know more is the cause of the occurrence or emergence of dependent variables, or what independent variables are causing the emergence of dependent variables. For example, what causes employees to stress (dependent variable). Is it causes sales volume to decrease (dependent variable)? what causes consumers to be dissatisfied (dependent variable). Is it true that inappropriate advertising ( independent variable) cause the decrease in sales volume (dependent variable) ? Is it true that one’s work motivation is low (dependent variable) due to low wages or salaries (independent variable)? He wants to know is what variables are causing all the negative things (symptoms) that arise or occur. With the aim of providing solutions to existing problems (job stress, decreased sales volume, unsatisfied consumers, etc.)

Causation

The causation highlights that there is a causal relationship between two variables. Simply, this highlights that A causes B. In scientific and health studies, the problem of confusion between correlation and causation often happen. In theory, it’s easy to distinguish, but the reality is not that simple. Many events can cause another event, such as lung cancer that is only occurs due to smoking. If an event causes another event, it has correlation among others. Two events that occur together do not mean the cause, for example smoking and alcoholism go hand in hand. But it is not one other cause.

Likewise in non-social sciences, causation research able to use the influence among variables. Someone who wants to know the effect of fertilizer application on plant growth will conduct various experiments in the laboratory and in the “field”. Plant growth is not only influenced by the presence of fertilizer, in order to truly know the effect of fertilizer, other variables probably have an effect on plant growth.

When a researcher sets the title “Effect of the amount of wages on the level of employee performance”, it explicitly describes what research methods should causation research. Why? Because the word “influence has meaning” effect “or” cause “. Researchers consciously or not, have put one status variable as an independent variable (the amount of wages), and one other variable as a dependent variable (performance level).

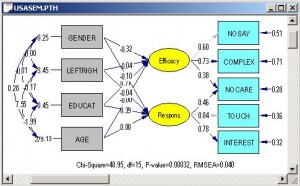
Structural Equation Modeling Path Analysis

Structural Equation Modeling Path Analysis

Structural equation modeling (SEM) is a statistical modeling technique that is very cross-sectional, linear and general. Included in this SEM is factor analysis (factor analysis), path analysis and regression (regression). Another definition mentions structural equation modeling (SEM) is a general and very useful multivariate analysis technique that includes a number of other analytical methods as special cases.

The next definition says that Structural equation modeling (SEM) is a statistical technique to build and to test statistical models that are usually in the form of causal models. SEM is actually a hybrid technique that includes the confirmatory aspects of factor analysis, path analysis and regression.

Advantages of SEM

Slightly different from previous definitions, Structural Equation Modeling (SEM) develops and has a function similar to multiple regression. Although it seems that SEM is becoming a more powerful analytical technique. It ables to consider interaction modeling, non-linearity, correlated independent variables, measurement errors, correlated error terms, multiple latent independent variables. It has many indicators, and one or two latent dependent variables that has also several indicators. Hence, SEM can be stronger than using multiple regression, path analysis, factor analysis, time series analysis, and covariance analysis

Its ability to decipher relationships between variables and to test theoretical credibility (or models). Which uses statistical techniques based on a number of very strict assumptions (Pedhazur, 1982). Three of the assumptions are that the variables the path analysis must be without errors, errors are uncorrelated, and the variables in the model are unidirectional (not including reciprocal models).

In many studies, almost all variables are unobservable variables. Variables such as educational aspirations, anxiety tests, student perceptions are latent behavioral concepts. The use of a single indicator to fully capture something complex in a path analysis is not practical. The nature of these variables in the path analysis requires the involvement of one or several indicators to construct each latent variable.

Path Analysis

Path analysis is an extension analysis technique of the regression model, which is used to test the dependence of a number of variables in a model. This model is generally depicted in a circle image and arrow direction that shows the relationship between the independent variable, mediator variable, and the dependent variable. The model is suitable for testing research hypotheses that show direct and indirect relationships. The causal model formulated by this researcher must be based on strong theoretical considerations.

This path analysis has advantages compared other analysis techniques. It is relatively simple and easy to do. In addition, we can analyze many variables with a relatively smaller number of samples.

The Weakness

As a comparison with SEM Full model, this path analysis only uses the total score of the variables only. While the full model on the SEM is a latent score. Since, it uses total score, that there is no measurement error in one variable. Therefore it is necessary to ensure that the measuring instrument has valid and reliable. Besides, the path analysis also can not see the accuracy index of the model. Therefore between one model with another model can not be compared.

Another weakness of the path analysis is that it does not allow the possibility of a link between residual error values ​​for each endogenous variable. Testing the model with the hypothesis of a joint effect (simultaneous) is rare. It is conceivable, academic experience will not only affect student performance. There is also the possibility of student performance affecting academic experience (eg learning, participating in study groups, accessing academic resources, engaging in class discussions). Thus, the use of path analysis to overcome problems like this is inappropriate.

Quantitative Research Hypothesis Examples

Quantitative Research Hypothesis Examples

In general, a researcher arranges hypotheses based on the formulation of problems and theoretical studies. For quantitative research, the hypothesis used is a statistical hypothesis, meaning that the hypothesis must be tested using statistical rules. Whereas for qualitative research does not need to use statistical rules. In a quantitative study, the formulated statistical hypothesis has two forms, the null hypothesis (Ho) and the alternative hypothesis (Ha). In general, hypotheses for quantitative research have three types: Descriptive Hypothesis, Comparative Hypothesis, and Associative Hypothesis.

Descriptive Hypothesis

Descriptive hypotheses are temporary conjectures about the value of a variable, not expressing relationships or comparisons. Remember, only about the value of a variable. Statistics used to test descriptive hypotheses are sample mean tests or standard deviation tests. A researcher formulates hypothesis based on the problem formulation and theoretical study. Following are some examples of problem formulations (PF), hypotheses (H).
PF: What is the percentage of junior high school mathematics mastery in the subject matter of the set?
H: Junior high school mathematics teacher mastery in the subject matter reaches 70%.

PF: How good is the grade XI mastery of class XI material?
H: mastery of class X material by class XI students reaches 75%.

Comparative Hypothesis

The comparative hypothesis is a temporary construct that compares the values ​​of two variables. That is, in the comparative hypothesis, we do not determine with certainty the value of the variables we examine, but compare. Means, there are two variables that are the same, but different samples. The statistics used to test this comparative hypothesis are (assuming normality is met) using a t-test. But before that, the normality and homogeneity must be tested first.
Following are some examples of problem formulations (PF), hypotheses (H).
PF: Is there a difference in the problem-solving abilities of students who got X learning better than students who got Y learning?
H: the problem solving ability of students who get learning X is better than students who get learning Y.

PF: Are there differences in the critical thinking skills of students who study during the day are better than students who study in the morning?
H: there is no difference in the critical thinking skills of students who study in the afternoon with students who study in the morning.

The two hypothetical examples above are slightly different. In the first hypothesis, we claim that the problem solving ability of students who get learning X is better than students who get learning Y. While in the second hypothesis, there is no one-sided claim that the critical thinking skills of students who learn during the day are better or worse. We only state that there are differences. Which problem is better, it does not concern this hypothesis. The first hypothesis is a one-party test hypothesis, while the second hypothesis is called a two-party test hypothesis.

Associative Quantitative Hypothesis

The associative hypothesis is a relationship between the relationship between two variables, the dependent variable and the independent variable. The statistics are used to test this comparative hypothesis are (assuming normality is met) using Product Moment Correlation, Double Correlation, or Partial Correlation.
The following are examples of problem formulations (PF), hypotheses (H).
PF: Is there a relationship between student achievement and the level of student anxiety?
H: there is a negative relationship between student achievement with the level of student anxiety.

PF: Is there a relationship between student learning outcomes and seating arrangements?
H: there is a positive relationship between student achievement with the level of student anxiety.

In the first hypothesis there are the words ‘negative relationship’. Negative relationship means inversely proportional. That is if the level of student anxiety is high, then student achievement is low. Whereas in the second hypothesis there are the words ‘positive relationship’. Positive relationship means directly proportional. It means if the seating arrangement is good, the student learning outcomes are high.

Ordinal Scale Definition and Example

Ordinal Scale Definition and Example

Ordinal scale definition is a scale showing sequential order and also serves to group. On an ordinal scale, the difference between values does not have any meaning, but only a sequence. Ordinal scale is impossible to make statistical calculations based on average calculations and standard deviations.

This Ordinal scale is higher than the nominal scale, it is a rating scale. In the ordinal scale, the symbol of the measured numbers is to show the difference and order or level of the object according to certain characteristics. For example, level of satisfaction on the product. We can give a number with 5 = very satisfied, 4 = satisfied, 3 = less satisfied, 2 = not satisfied and 1 = very dissatisfied. Or for example in a race, the winner gets rank 1,2,3 etc. On an ordinal scale, unlike the nominal scale, to replace the numbers, we need to sort the sequence from large to small or from small to large. So, we shouldn’t make 1 = very satisfied, 2 = not satisfied, 3 = satisfied etc. Which is 1 = very satisfied, 2 = satisfied, 3 = less satisfied and so on.

Ordinal Scale More Example

In addition, although ordinal scale has a clear boundary but does not yet have a distance (difference). We do not know the distance from satisfaction from dissatisfied to less satisfied. Eventhough, very satisfied with the number 5 and very dissatisfied we give the number 1. But, we cannot say that satisfaction that is very satisfied is five times higher than that which is very dissatisfied. As on a nominal scale, it also cannot apply standard mathematical operations (arithmetic). Such as subtraction, addition, multiplication, and so on. Statistical parameters that is in accordance with ordinal scale is similar on the number and proportion. Such as mode, frequency distribution, Chi Square and several other non-parametric statistical equipment.

Ordinal Scale is a scale that is the second level of measurement, tiering into something that is ‘more’ or ‘less’ than others. This measure is to sort objects from lowest to highest and vice versa. Example: measuring sports championships, work performance, employee seniority. For example: Answer questions in the ranking. For example: strongly disagree, disagree, neutral, agree and strongly agree get symbol numbers 1, 2,3,4 and 5. These numbers are only ranking symbols, do not express numbers.

The symbol indicates the order or level of the object measured according to the characteristics. For example, we want to know the preferences of respondents towards a noodle brand. brand A, brand B, brand C, brand D and then respondents rank noodle brands by giving number 1 for the most preferred brand, number 2 for the second rank, etc. A summary of the results as follows: Brand A = 1, brand B = 2, Brand C= 3, Brand D = 4

Statistical measurement: Nominal Ordinal Interval Ratio Data

Statistical measurement: Nominal Ordinal Interval Ratio Data

In statistics we know the scale of data measurement : nominal data, ordinal data, interval, and ratio. In general it can be said that the purpose of an observation is to obtain about the condition of an object in various circumstances. Among the various measurements for objects, which are numbers, rank, length, volume, time, weight, and physical-chemical measurements.

There are four measurement scales in Statistics:

Nominal Data

Firstly nominal Scale is the simplest measurement scale. It groups objects into several groups, which have similar features will be in one group. Nominal scale measurement results not to sort but can distinguish. Common examples commonly used are gender variables. In this case the measurement results cannot be sorted (women are higher than men, or vice versa). Examples of nominal scale applications: trademarks, types of shops, sales territories.

Ordinal Data

Secondly ordinal Data describes the position or rank but do not measure the distance between ranks. Size on an ordinal scale does not give an absolute value to an object, but only a relative sequence. Furthermore, the distance between rank 1 and 2 does not have to be the same as the distance between rank 2 and 3. On an ordinal scale, the rank does not have a unit of measurement. For example: social status (high, low, medium), measurement results that classify people into high, low or medium social status. In this case, we can know the level, but the difference between social statuses (high-low, low-medium, high-medium etc.) is not necessarily the same. Example application: preference level, management position, career path.

Interval Data

Thirdly interval scale gives the numeric characteristic to objects that have nominal and ordinal scales. It has the same distance in the order of the object. Interval scale is the level of this scale above the ordinal and nominal scale. Therefore, an important feature of this scale: we can add, subtract, duplicate, and share without affecting the relative distance of the scores.

Furthermore, this scale does not have an absolute zero. We cannot interpret in full the value of a certain ratio. In interval measurement switches, the ratio between two arbitrary intervals does not depend on the value of zero and the unit of measurement, For example, measurement of temperature on a Celsius scale. If a water bath is full of 0 degrees C, 50 degrees C, and 100 degrees C, the difference between 0-50 and 50-100 degrees C is the same. We cannot say that water at 100 degrees C is twice as hot as water 50 degrees C. Example application: Employee performance appraisal (on a scale from 0-100)

Ratio Data

Further ratio scale has all the properties of the interval scale plus one trait to give information about the absolute value of the object. It aims to distinguish, sort, certain distance, and we can compare (the most complete, including all of the scales above). Example: If we want to compare the weight of two people. A weight 40 kg and B 80 kg. We can know that A is twice as heavy as A. Because the value of the numerical variable weight expresses the ratio with zero as its default. Other examples: Age, value for money, height, etc.


The measurement scale above ranks from the low level (1 nominal scale) to the highest level (4 ratio scale). Measurement Scale with a higher level of measurement can change to a lower level, but the opposite.
Knowing this measurement scale will benefit a study. In the analysis, it needs measurement and what analysis tools are fit to answer the research objectives.

Comparative Studies Definition and Statistical Analysis

Comparative Studies Definition and Statistical Analysis

Comparative analysis aims to see the difference in the average of the dependent variable between two or more groups. The comparison test (dependent variable) for the two sample groups is the T test. The test for more than two groups of samples is the F test (ANOVA). Furthermore, comparative analysis requires normal distribution. Besides the variance must be homogeneous.

T test consists of one sample sample T test and two sample t test. One sample a test to examine a group of sample against a benchmark/standard value. for example, the researcher wants to test whether one group of students has a TOEFL test score above 500 or below 500. While in the two sample T tests, the researcher compares the population mean in the two sample groups. for example, researchers will compare the average TOEFL score in class A compared with class B. Does class A have an average TOEFL score that is the same as class B?

Furthermore, 2 sample t tests consist of paired samples and independent samples. We use paired samples when we compare two groups of samples which are basically one group. For instance, we compare the TOEFL score of class A before and after training.

It’s clear that the research subjects are the same but only at different times. In this paired sample t test, the number of samples must be the same. The subject will be tested before and after.

In independent samples, the subjects is different. For example we compare class A and class B at one time. The number of samples also allows different. Since the population of class A could be different with the population of class B.

When comparing more than 2 groups, we need ANOVA test. For instance, we examine whether group A, group B and group C have the same TOEFL score. In this test, it is possible to compare the same or different subjects. For example we compare the score of TOEFL in group A group B and group C. This test is only extension of the independent sample test. Likewise comparing group A before training 1, after training 1 and after training 2. The subject is only group A.

ANOVA test is technically different in calculations with T. ANOVA test, the basis of ANOVA is not average but variance. While the basic T test is average. Essentially the purpose of both calculations is the same.

Difference Between Finite and Infinite Population

Difference Between Finite and Infinite Population

Population is a generalization area consisting of: objects / subjects that have certain qualities and characteristics determined by researchers to get conclusions.

Finite Population

A finite population is a collection of objects or individuals that are objects of research that occupy a certain area. It clear boundaries that distinguish these population groups from other populations.

For example: the population of ducks in one cage, the number of A class students, the male population in an environment, and so on.

So the population is not only people, but also objects and other natural objects. Population is also not just the amount that exists on the object / subject studied. It includes all the characteristics / properties possessed by the subject or object.

For example, doing research in college Y, then college Y is the population. College Y has a number of people / subjects and other objects. This relates to the population in terms of quantity / quantity. But college Y also has the characteristics of its people. For example: its work motivation; work discipline; leadership; organizational climate and others. Furthermore: it also has other object characteristics: such as policies, work procedures, classroom layout, graduates produced and others.

One person can be as a population. Since, one person has various characteristics: style of speech, personal discipline, hobbies, ways to get along, his leadership and others. It will conduct research on President Y’s leadership then that leadership is a sample of all the characteristics possessed by President Y.

In the medicine, one person often acts as a population but not representing the unit of analysis. The blood is unit of analysis itself. If you want to observe the blood. Certainly, the population is person due to the blood inside the person.

Infinite Population

Infinite population is a collection of objects or individuals that are no boundaries or we can not measure about the total number of individuals in the occupied territories. For example, the population of stars in space, the number of red blood cells in a person’s body, and so on.

A large population will make it difficult for researchers to conduct a research. Requiring a lot of time and money to observe all populations. For the reason that a study of only needs some elements to represent the population. That is sampling.

Basically we can change infinite populations to finite population. We only need to impose limits on the population that we will observe. For instance, infinite population of fish in the ocean. By changing the fish population space, for example we put it in a pond or aquarium. It will become a finite/limited population. Even more, limited population is able to count, rather unlimited population has a number beyond our ability to count.

Regarding population, the smallest unit in a population is an element. Element is our observation focus. In these elements we will observe the characteristics of each element. Researchers call it a variable. As a result variable is source of information of the population.

Originality Research Topics for College Students

In a scientific paper, originality of research topics is a major element when a student or researcher write paper/ thesis or research report. Originality is a novelty of the study. Good research has new findings that contribute both to science and real life. However, the challenge is how to find interesting topics while original. Since, many research topics are trapped on the plagiarism issue.

Change Research Population

If we dismantle a thesis or dissertation in the library, most of the topics refer to previous research. Whether the study whose similar topic with previous research stay original? The answer is yes. A thesis / dissertation /scientific paper has originality even though it involves previous research but different in location. For example, researchers conduct research on the effect of tariff or quota enforcement towards reducing product import in a country. Researchers in different countries can conduct research with the exact same variables. It is not plagiarism as long as researcher writes quotations with the correct rules. A study might involve the exact same variables with other studies. However, when the research location is different, it is still original paper.

In order to write a thesis / scientific research that has originality in topic, start by examining the phenomena that occur around you. Start browsing on the internet whether has similar topics of study. If there is a similar topic, begin to discover whether the conditions in the study are the same as the conditions in the phenomena you observe. If the conditions are not the same then your research topic might be original.

Combining Several Research Topics

Another way to write an original research is to combine several research topics into your main research topic. Certainly, you must read many previous research references. Furthermore, you look for the common thread of each study. Usually, between studies have a link. among the links there is a common thread to become your research topic. This way is not plagiarism.

Example in economics subject, we read some following research topics: the impact of the rise in the economy on the domestic economy; The impact of interest rates on stock index; The impact of the global economy towards domestic economy. Based on the three research topics above, we can combine into new research paper topic. for example, the influence of the global economy on the domestic economy.

In addition, you also need to pay attention on the theoretical basis that supports so that between variables interconnected.

Descriptive vs inferential statistics

Descriptive statistics definition is different with inferential statistics. Descriptive statistics only describes condition of the data through parameters such as mean, median, mode, frequency distribution and other statistical measurements. While inferential statistics conclude hypotheses based on sample data into population conclusion. In the descriptive statistics, we need to present:

1. Central tendency. Central tendency measurement most used is frequency distribution. These statistical measures are suitable for nominal and ordinal data (categorical data). While the mean is a measurement of central tendency for continuous data. Other descriptive measurement for central tendency is median (mid value) and mode (most frequent value).

2. Dispersion. Standard deviation is a dispersion measurement to represent spread of the data. It is suitable to measure diversity of numerical or continuous data. For categorical data, Range is suitable measurement.


Inferential vs Descriptive Statistics

While, inferential statistics is to conclude hypothesis based on the data samples into more general conclusions as whole population. Inferential research is needed if the researcher has limited research budget more efficiently so as to research done by taking several of samples less than the whole population. In the inferential study, conducted prediction. Inferential statistics requires the fulfillment of assumptions. The first assumption must be met is randomization process in sampling. This is necessary because the inferential statistics need representative population. Other assumptions that need to be met is depend on the analysis tools used. In the multiple regression analysis, the assumptions must meet multicollinearity, heteroscedasticity, autocorrelation and normality.

Statistical analysis methods used in inferential statistics are T-test, ANOVA, Anacova, regression analysis, path analysis, Structural equation modeling (SEM) and other analysis methods depending on the purpose of research. In inferential statistics, we examine hypothesis to determine whether a statistical measurement represent broader conclusions in the population. Measurement such statistics will compared to the population distribution pattern as the norm. Therefore, knowing the pattern of sample distribution to be important in inferential statistics.

Inferential Statistics in Practice

A good example of inferential statistics is in the presidential election. Many agencies conduct quick count survey to get quickly result, therefore knowing the elected presidential more quickly. The survey agency take several polling stations called TPS  as sample of the total population. TPS sample are used to generalize the overall population. Say, taken 2,000 samples of 400,000 population. The results of 2,000 polling stations are descriptive statistics. Whereas if we take the conclusions of the 400,000 polling stations is inferensial. the strength of inferential statistics depends on sampling techniques and the randomization process. If the randomization process is done correctly, then the result able to predict the population precisely. Therefore, it can save money  and time.

In the manufacturing industry, inferential statistics are very useful. Management can determine and control how many products outside the standard or defective by taking a few samples. Imagine if the management company must check all the products just to find out the defect. Certainly will spend many time and cost. Especially if we have to check all the products are packaged. Certainly not effective and efficient. Fortunately, there are Six Sigma, one of the tools used in this regard. Six Sigma principles using inferential statistics take product samples and measuring sigma or standard deviation (a measure of diversity) of the product. The number of defective products shall not exceed the certain standards.

Source reference:

1. http://www.socialresearchmethods.net/kb/statinf.php
2. https://statistics.laerd.com/statistical-guides/descriptive-inferential-statistics.php

Exploratory factor analysis vs confirmatory factor analysis

cfa

This article will discuss differences between exploratory factor analysis and confirmatory factor analysis. Exploratory factor analysis is abbreviated wit EFA , while the confirmatory factor analysis known as CFA .

About Exploratory Factor Analysis (EFA)

EFA is a statistical method to build structural model consisting set of variables. EFA is one of the factor analysis method to identify the relationship between the manifest variables in building a construct. Researcher also mention manifest variables as indicators variable. A researcher uses EFA when he does not have a beginning information in grouping set of indicators. So researchers set of indicators (manifest) then create variables. In conditions where the latent variables does not have clear indicators, the EFA is an appropriate method. Possibly, indicators of the latent variable indicators of possible overlap with other latent variables.

Researchers can use SPSS software to analyze EFA. All data of indicator input into the software. Therefore there is no assumption group of indicators. In EFA, we do not know how many factors or latent variables will create. Although researchers allow to determine how many the expected number of factors.

Factor loading is a measurement indicating into which group an indicator will gather. When the value is greater then these, then indicators will gather in the same factors.

About Confirmatory Factor Analysis (CFA)

CFA is one of factor analysis, commonly in social research. This method examines whether statistically the indicators gather consistently in a group. In the CFA, researchers test whether the data fit to the model established previously or not. The fundamental difference between the CFA and EFA is: in the CFA, researchers have prior assumption that indicators fit into a certain latent variables. Researcher has develop a hypothetical model based on the theoretical framework or previous studies referenced.

Therefore, there is an established model to examine, then the CFA test the model. CFA is a part of Structural Equation Modeling (SEM).

Fitness Measurement in CFA is the same with SEM fitness index. Chi Square, RMSEA, GFI, AGFI are some fitness index to use beyond the weighted value of each indicator.

The similarity of EFA and CFA

One of the similarity between EFA and CFA is a variance to measure the contribution of construct variables.

Normal Distribution Generator in excel

normal distribution

source: Fonlinecourses.science.psu.edu

In a study, sometimes we face a limited amount of data and data is not normally distribution. Whereas statistical data require much or at least 30 data to meet the parametric prerequisites. The question is whether allowing to use normal distribution generator with a limited numbers. The answer is allowed. Even if we only know the value of the mean (average) and standard deviation of the data, then we can perform simulations to 1000 data or more. For example, we know the value of the mean = 20 and the standard deviation is 5, and the sample from population that is normally distributed. To obtain normally distributed random numbers or a particular distribution. we can use Monte Carlo simulation using various software available.

The steps to simulate the limited data that follow a particular distribution pattern is as follows:

1.Define value starting point

To get the next random number requires starting point. However, the numbers starting point does not significantly affect the data simulation, because the starting point of this figure is just one figure among the thousands of numbers that will be obtained based on the simulation results.

 monte carlo simulation 1

2. Determine the expected population distribution

Prior to the simulation data, we must determine the distribution assumption of population data that we expect. For example, we assume that the data will follow a normal distribution pattern.

We need to know the various types of distribution in accordance with scale of the data.

If the data is a numerical scale that allows below distribution: normal distribution, log-normal, exponential, and others.

Meanwhile, if the scale is categorical, so the distribution are: binomial distribution, uniform distribution, multinomial distribution, hiper geomertric distribution and so on.

 monte carlo simulation 2

3. Determine the required assumptions for population distribution

Every distribution has certain statistical parameters. For example, if we assume a normal distribution, then at least we should know two parameters: mean and standard deviation. these two parameters will be used to generate other data.

 monte carlo simulation 3

4. Running data based on the assumption

After determining the necessary assumptions, the next process is running data. We can process/running using iteration until 1000 and even up to more than 1000 times. If we do a running 1000 times then we will get 1000 random numbers that follow the pattern of distribution that we choose.

 monte carlo simulation 4

5. Make reports

Once the data is complete for running, then the output can be clicked to display the output of any report required

 monte carlo simulation 5

The result is that we will get random numbers 1000 data that follow certain patterns of distribution, such as the normal distribution. Obviously the parameters mean (average) and standard deviation will follow the 1000 data from the above simulation. Expected with more iterative process, it will produce a smooth data approaching population data.

Similarly, limited data into a simulation process Monte carlo simulation using Crystal Ball software by Oracle.

SEM Structural Equation Modeling with Lisrel, AMOS or SMARTPLS?

olah data sem

SEM (Structural Equation Modeling), or better known as SEM is a multivariate statistical analysis method. SEM has differences in data processing regression or path analysis. SEM data processing is more complicated because SEM built by both measurement model and structural model.

To process SEM data easily, we need a statistical software. There are many software for SEM data such as: Lisrel , AMOS and Smart PLS . Among the statistical software, which is suitable for use. below’s a short review :

Advantages of Lisrel for SEM Structural Equation Modeling

Lisrel developed by Karl Joreskog and Dag Sörbom. Lisrel statistical software is the most familiar among researchers and practitioners. The advantages of the LISREL software is its ability to identify relationships between variables are complex. How to operate it consists of a choice, either with syntax and simple lisrel, making it more widely used in various discipline. Syntax certainly be favored for users who are familiar with the programming language. While SIMPLIS or simple LISREL is an alternative for those who are unfamiliar with programming languages​.

A selection of various methods of estimation are available in lisrel, so do not cling to the Maximum Likelihood estimation method. It depends on the condition of the data, estimation methods which will be used.

Disadvantages of Lisrel

One of the disadvantages is its inability to process data with small sample size. When we have a sample of less than 200 samples, while the model is complex, it is sometimes the estimation results are not in line with our expectations.

Advantages of Amos for SEM Structural Equation Modeling

As with SPSS, AMOS is a statistical software developed by IBM. Amos software helps to examine the hypothesized relationship between variables. Through this software, we can determine the level of the strength of the relationship between both variables between the latent variables and the manifest variables. How significant relationship between the variables, and how fit model hypotheses compared with real data field.

With Amos, we do not need syntax or complicated programming language to operate the software. For beginners, or those who are unfamiliar with the programming language is an advantage. Through Amos, we simply describe the latent variables and manifest variables, and then connect it using arrows are available.

Disadvantage of Amos

Advantages of Amos as well as its disadvantages. We need to create many images when the model is complex, and it was very tedious work. Whereas in Lisrel, it is more simple with programming language. We just copy and duplicate the syntax, then running, then complete the model, as complex as any models we want.

Advantages of Smart PLS

Smart PLS or Partial Least Square is a statistical software with the same goal with lisrel and AMOS. They examines the relationship between variables, good fellow latent variables and indicator variables, or manifest.

Researcher uses Smart PLS when the subject has limited number of sample. While the model is built complex. It is not run when we use Lisrel or Amos. they require the adequacy of the sample.

Another advantage of Smart PLS is its ability to process data both the  formative and reflective SEM model. Formative SEM models is a model when the indicator variables form a construct variable. So, the arrow head to construct variable from indicator variables. Otherwise, Reflective SEM Model is a model when a construct variable reflects its indicator variables. So that the arrow heads from the construct variable to its manifest variables. Statistically, the consequence is that there will be no error in the value of the indicator variable.

Disadvantages of Smart PLS

Therefore this software only to process data in small size, it is not suitable for research with large sample.

How to analyze questionnaire data using SPSS

How to analyze questionnaire data using SPSS

How to analyze questionnaire data? It must pass through various stages, ranging from data entry into the computer processing through SPSS or Ms. Excel, testing the validity and reliability, descriptive analysis and hypothesis testing. Here is the stages:

1. Validity and Reliability

What distinguishing between questionnaire data processing method with secondary data are validity. When we conducted the study with a questionnaire, so we need to test the validity and reliability of the questionnaire. Why need to do? because the questionnaire was arranged by researcher, meanwhile answering the questionnaire is respondent. The purpose is to minimize interpretation gap between researcher and respondent.

Moreover, Good questionnaire should be well understand by respondents as good as the questionnaire maker. A Questionnaire should has high level of consistency over times.

Otherwise, in secondary data, we do not need to test the validity and reliability.

2. Entry Data

Furthermore, After the questionnaires collected, it needs to input the data into a computer. The most common software for data entry is excel. Surely, spread sheet Excel are familiar among us. How to arrange the data in spread sheet. Stacking down in the spread sheet is the respondents. Meanwhile, the column fill by the item number or questionnaire answer. Likewise, Input data into SPSS is similar with spreadsheet Excel. The data arranges on row as respondent and column as question.

For closed questions, we can give score for each answer option in your question. For example, the answer: strongly agree = 5, agree = 4, neutral = 3, disagree = 2, and strongly disagree = 1. Only the score input into spread sheet.

In certain conditions, negative questions are possible? In such conditions, reversely the score of 5 changes to 1, 4 to 2 and so on.

 3. Descriptive analysis

To present the questionnaire results, researcher need to process the data using descriptive analysis. What type of graph is suitable for secondary data? Frequency distribution format is a common to present in descriptive. The display is presented how the number of respondents who answered agree, how that answer did not agree and so on.
In descriptive statistics, common measurement need to provide such as: mean, median, mode and standard deviation. However, when we provide ordinal data as mean and standard deviation, in fact we’re treating these data into numeric data.

4. Hypothesis testing to analyze questionnaire data

Is a questionnaire research able to test a hypothesis? The answer is sure. Actually, Likert scale questionnaire data is ordinal data. It is most appropriate statistical technique is non-parametric techniques. However, due to limitations of statistical tools in non-parametric analysis, somehow data transformation is applied to transform ordinal data into a numerical scale. Even though, transformation method is not a must, as long as the data distribution is normal, then statistical parametric methods can apply.

Having trouble in questionnaire data processing? contact us at +6281321898008

Data Analysis in Research Quantitative and Qualitative

Data Analysis in Research Quantitative and Qualitative

Research method is different with research techniques although it is similar in term of word. Data analysis method refers to a more general approach and data analysis technique is part of data analysis method. Research methods broadly divided into two parts: quantitative and qualitative method. Whereas, data analysis in quantitative research has various analytic techniques such as correlation techniques, regression, comparative, descriptive and such things.

Methods of data analysis in quantitative is a data processing approach through statistical or mathematical methods from primary or secondary data. The advantages of this method is more comprehensive.

Data Analysis in Quantitative Research

Quantitative data analysis method consists of several analytic techniques such as:

1. Descriptive analysis, we describe the results of the data collected it is through statistical measures such as mean, median, mode, and standard deviation.

2. Comparative analysis, we compare the fruit phenomenon with other phenomena, or we compare the same phenomenon in different subject groups.

3. Correlation Analysis, we examine the connection between a phenomena with other phenomena which in theory previously.

4. Causality Analysis, we question again causality between several phenomena in theory actually has allegedly interplay.

Quantitative data analysis methods are familiar in science, economics, engineering, medicine. Although, today many social research method applies in exact sciences, economics, engineering, medicine. So the approach used methods often use a quantitative approach.

Data Analysis in Qualitative Research

Methods of qualitative data analysis is a data processing approach in depth observations, interviews, literature data. The advantages of this method is in depth of study results.

Qualitative data analysis methods are more widely used in social sciences, law, sociology, politics, etc. Currently, many social subjects use quantitative methods. Qualitative methods provide advantages in terms of depth of analysis that is required in the social field. How can examine the culture of a particular ethnic group without a profound observation. How can explore the philosophical aspects of specific provisions in the law if no in-depth review. Obviously for such things necessary qualitative methods.

Qualitative data analysis method consists of a variety of analytical techniques such as:

1. Method of data analysis is necessary to organize qualitative data to be more organized. Why is this necessary? because as we all know that in qualitative research there is no such thing definite measurement, moreover a standardized scale such as in quantitative research.

2. The method of data analysis is necessary: ​​Coding of data needs to do, because the measures of data mostly in the form of verbal rather than in the form of numeric, the researchers need to do coding for homogenize some things that have the same meaning.

3. The method of data analysis is necessary: ​​Connect one concept with other concepts that may influence each other, the size of the relationship or influence can not be described by numbers.

4. method of data analysis is necessary to legitimate the results by comparing another concept that we-think contrary to the conclusions. How many other concepts that are contrary to the conclusions.